|
 |
||||
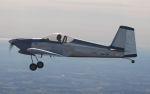
I was very happy with my last flight of gathering AOA data, but the one this bothering me was the AOA data had a lot of noise in it. There was some pretty drastic data value changes from one datapoint to the next. No fault of the sensor, this is just normal. This flight I wanted to collect data at a more granular level and work on processing it. The last flight I was gathering data at 100 ms intervals, or 10 samples a second. This time up I was collecting data at 1 ms intervals, or 1000 samples a second. My trusty laptop was connected up to my sensor and into the air we went! 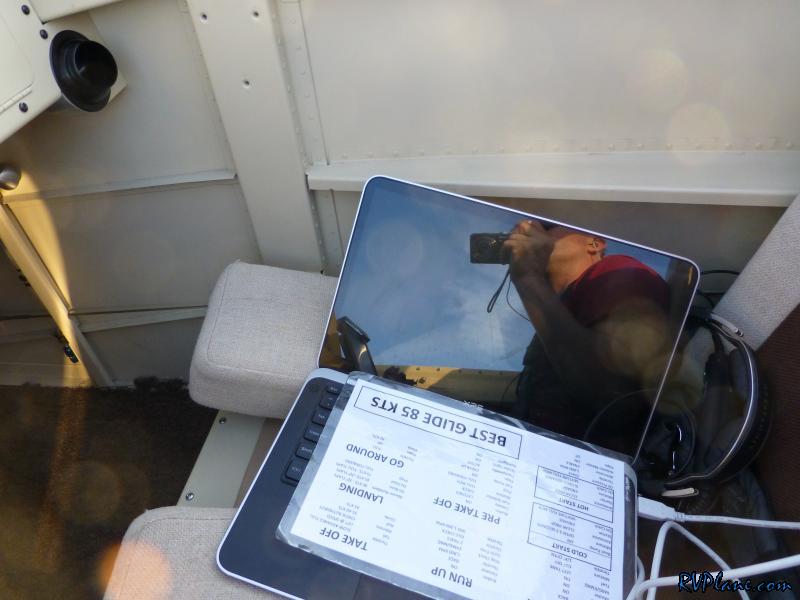 Summer haze...I am used to being spoiled with winter visibility. 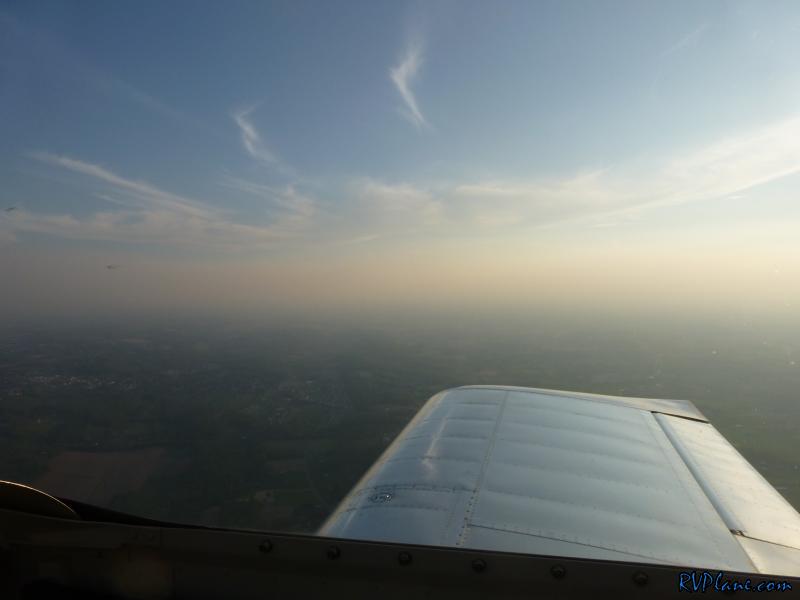 At least it's nice and green out. 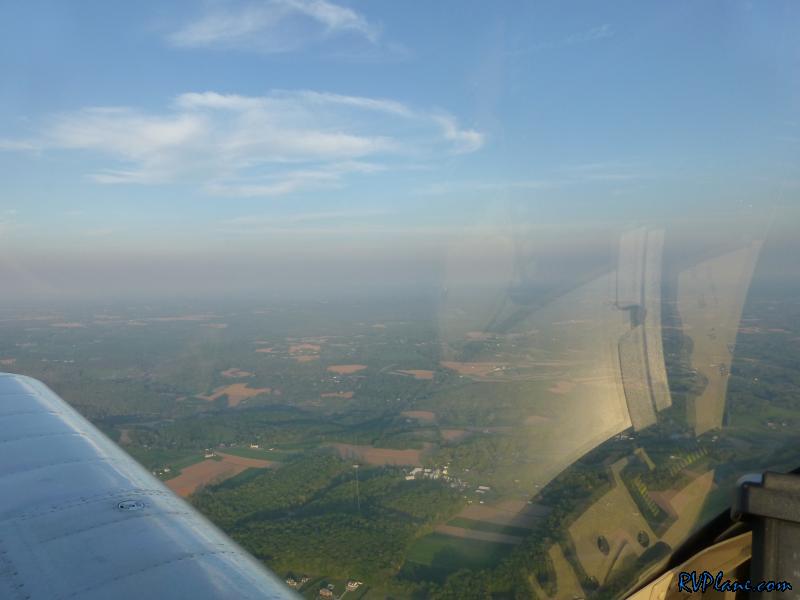 I flew over Sagamore Farms, owned by Under Armour's CEO, Kevin Plank. They were setting up a little tent for their annual pre-Preakness party. 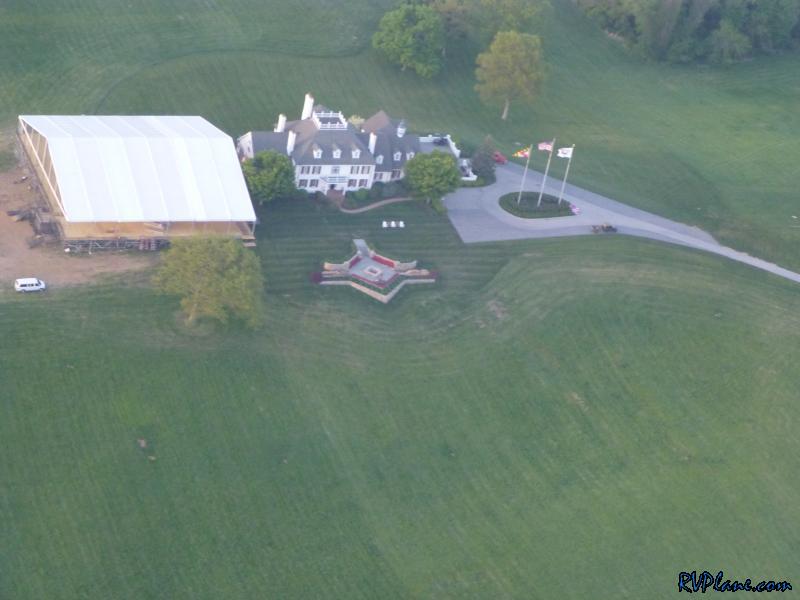 Now onto the good stuff. This data is processed and has a lot less noise than my previous data. What I did was every 50 data samples, I'd eliminate the top and bottom 10% of the data. Once the high and low data points were eliminated, I then averaged out the remaining values. Next I take an average of the prior 5 averaged samples, and average them together. What that does is provide me with some nice normalized data. The downside to this is my AOA reading can be up to 250 ms (1/4 of a second) delayed. However, with any normalization of data, there is some cost in terms of delayed time for the benefit of smoother data. Here you can see the data looks way smoother than my previous samples. To the left you can see two zero-G maneuvers, followed by a stall. I am pretty happy with this processed data - I think I can move on to implement this within the Arduino processor and get real values to display on the AOA indication. 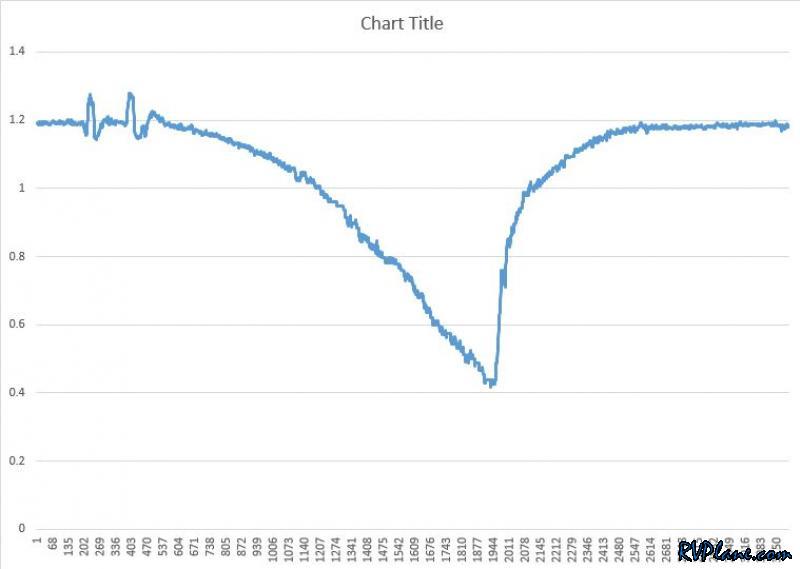
|
|||||
|
http://RVplane.com |
Last Modified: January 31, 2026 |